Most of people are now aware of the word “Work Force” Thanx to our Prime Minister. At various places he highlighted about young large work force of India. Often this tag line is referred to while talking about #MakeInIndia.
What is Work force? Often it can be referred to as Labour Force.
What is Labour force? : Persons who are either ‘working’ (employed) or ‘seeking’ or available for work (unemployed) or both during a major part of the reference period, constitute labour force.
The Labour Force Participation Rate(LFPR)- is a measure of the proportion of a country’s working-age population that engages actively in the labour market, either by working or looking for work. It provides an indication of the relative size of the supply of labour force available to engage in the production of goods and services.
Census definition of worker is slightly different from NSSO. The person who is engaged in economically productive activity during the reference period of one year preceding the date of enumeration was considered as worker. A person who has participated in the economically productive activity for 183 days or six months or more during the reference period was termed as a Main worker and the person who participated for less than 183 days or six months during the reference period was termed as Marginal Worker.
For the first time in Census 2011, the marginal workers, i.e. workers who worked for less than six months in the reference year, have been sub-divided in two categories, namely, those working for less than 3 months and those who worked for 3 months or more but less than six months.
Worker Population Ratio: The WPR signifies the proportion of workers/employed persons in the total population for the specific age group. All the labour force related parameters are derived for the persons aged 15 years and above.
Table 3.2: Worker Population Ratio based on UPS and UPSS approach for persons aged 15 years & above All India (in %) taken from report of Labour Bureau, Chandigarh
Approach |
Rural | Urban | Rural + Urban | |||||||||
| M | F | T | P | M | F | T | P | M | F | T | P | |
| UPS | 74.1 | 24.6 | 50.0 | 50.4 | 66.8 | 14.3 | 36.9 | 41.4 | 72.1 | 21.7 | 45.9 | 47.8 |
| UPSS | 75.7 | 30.2 | 51.9 | 53.9 | 67.1 | 14.8 | 36.9 | 41.8 | 73.3 | 25.8 | 47.2 | 50.5 |
(report on fifth annual employment & unemployment survey 2015-16)
As per census 2011 work participation rate(WPR) of India is 39.8%. [Rural-41.8 and Urban-35.3%] it has slightly increased from that of 2001. There is another WPR that is known as worker population ratio.
Highest WPR in country was in Himachal Pradesh with 51.9%. Second highest WPR was in Sikkim at and third highest of Daman & Diu at 49.9%.
Among the rural areas of India highest WPR was of Nagaland at 54%, with 53.3% there is tie for second highest WPR between Himachal Pradesh and Sikkim.
Similarly looking at Urban India we find highest WPR urban was in Daman & Diu with 53.6%, Dadra Nagar Haveli(urban) with 45.5% was second highest in India. Sikkim(urban) with 41.9% was third highest in India.
Work Participation Rate is higher in Rural areas than urban areas? Does it not sound strange to ears of urbanites? Since it goes against the common perception of urbanite that “work” is more in urban areas thus quite often people tend to migrate to urban centres. If you don’t agree then ask any person of urban areas. Often we will find that very few are really aware of the problems in Rural areas.
Census considers certain categories of workers as per their definitions and based on that data is collected through door to door survey and based on response.
Gender wise data show that work participation of Males is 53.3% [Rural- 53% and Urban – 53.8%] this indicates that within the male category there is not much difference between the working of males among rural and urban areas. It is approx at 53%.
Work Participation Rate of Female is 25.5% at all India level. [Rural – 30% and Urban- 15.4%]. Here lies the difference. First is the huge difference between genders, ie. WPR of Male is 53.3 and that of female is 25%. Another difference was found within the gender of Female i.e. gap in rural and urban females. That is rural female WPR is 30 but urban female WPR is 15.4%. Urban has less WPR than Rural areas? Is it not opposite than common perception of urban persons.
Either unemployment among urban female population is more than rural or the perception that female do not work is a hindrance in urban areas? Or lack of opportunity of employment in urban areas?
This data indicates that women in rural areas work more in comparison to urban female.
Among the male worker category WPR males was highest in Daman & Diu with 71.5%. Second highest WPR male in country was in Dadar Nagar Haveli at 61.6%. Third highest was in Sikkim with 60.2%. Fourth highest WPR male was in A & N Islands at 59.6%
Among rural India Chandigarh stood highest with 62.2% WPR male. Second highest WPR male was in Sikkim with 61%. Third highest was in Tamil Nadu at 60%. Next comes Karnataka with 59.8% as fourth highest WPR male and A & N Islands with 59.1% was fifth highest.
Among the Urban areas WPR males was highest in Daman Diu with 75.1%. Second highest was Dadra Nagar Haveli with 66.5% WPR male. Third highest was A & N Islands with 60.4% followed by Tamil Nadu with 58.5% at fourth highest WPR male urban. 5th highest was in Karnataka at 57.8% WPR male urban.
Female work participation Rate:
WPR female at all India level was 25.5% [rural – 30% and Urban-15.4%]
Highest WPR female was in Himachal Pradesh at 44.8% followed by Nagaland as second highest with 44.7%. Chatissgarh was at third highest WPR female with 39.7% WPR female. Sikkim had fourth highest WPR female as 39.6%.
Among rural India Nagaland had highest WPR female as 52.3%. Second highest WPR female was in Himachal Pradesh at 47.4%. Chatissgarh was at third highest WPR female at 46.3% and with 44.6 there was tie between Andhra Pradesh and Sikkim at fourth highest place.
Among the Urban areas highest WPR female was in Manipur at 33.2%, second highest was Mizoram with 31.1%. Third highest was Nagaland with 25.8% followed by Sikkim with 24.8% as fourth highest.
5th highest was Meghalaya with 23.6% WPR female urban, followed next by Tamil Nadu with 21.8% at Sixth highest.
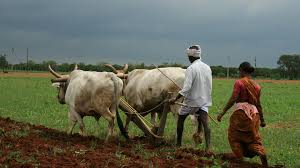
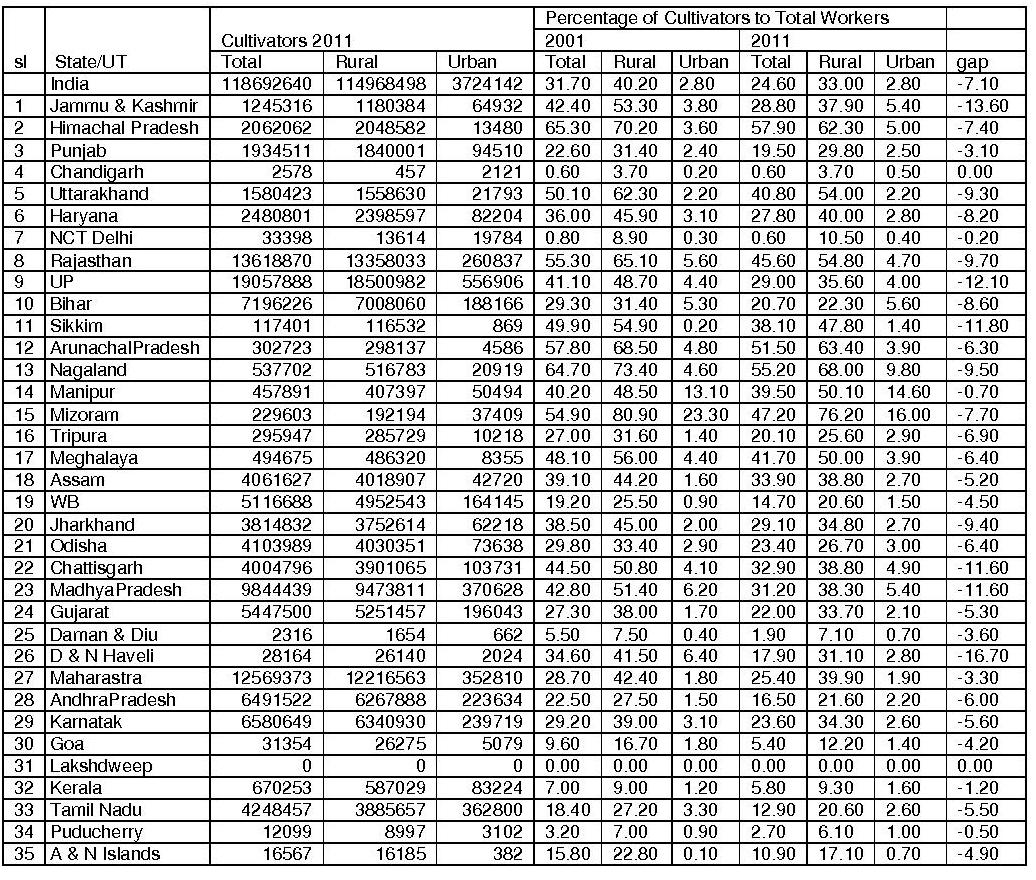
Cultivators is a category of workers on which data is collected in population census of India. In 2011 highest percentage of cultivators to total workers was in Himachal Pradesh at 57.9%. Second Highest percent was in Nagaland at 55.2% followed by Arunachal Pradesh with 51.5%. Fourth highest % of cultivators was in Mizoram with 47.2, Rajasthan with 45.6% at 5th highest, Meghalaya with 41.7% as the 6th highest. Uttarakhand with 40.8 was 7th highest in country followed by Manipur at 8th place with 39.5% cultivators to total workers.
Now this is strange that when we talk about Agriculture immediately we imagine UP, AP, Punjab, Haryana etc as the states where we agriculture is prevalent. Therefore could we say that percentage of cultivators also should be greater or large. Now looking at census data we find that out of total worker population as described in above para proportion of cultivators is more among the North Eastern States of India. Most of them had highest proportion of cultivators.
Andhra Pradesh, Tamil Nadu, Punjab, Kerala, West Bengal and Bihar which we perceive as Agriculturist states had less than 20% of cultivator proportion of total workers.
Now the data of Rural areas tells what?

Among Rural areas with 76.2% Mizoram had highest cultivator percentage to total workers. With 68% Nagaland had second highest cultivator%. Arunachal Pradesh had 63.4% that was third highest. With 62.3% Himachal Pradesh was fourth highest.
Among the rural areas we find that not many states had even 50% percentage of cultivators to total worker population. Rajasthan-54.8%, UttaraKhand-54%, Manipur and Meghalaya had 50% cultivator proportion to total workers. Rest states had less than 40%. This data shows the percentage of cultivators to total workers.
In all most all the states we find that percentage of cultivators among workers has diminished. In few states it is alarmingly high.
In J&K percentage of cultivator to total workers is 28.8% in 2011 where as it was 42.4% in 2001 census.
last column shows the decline in the cultivators since 2001 census. The common perception of states those producing rice or any food grains was that they may be having large number of cultivators. But looking at above table we can see how it is different. Present India (census 2011) is not of rural India, even though approximately 60% population is in rural areas. Urbanization is increasing at high pace. Here only concern is of cultivation or agriculture?
Percentage of Male cultivators to total workers is 24.9. [Rural- 35.2 & Urban-2.7]. Percentage of Female cultivators to total workers is 24 [Rural-28.8 & Urban-3.1]. Both these percentage have decreased from that of 2001. Male cultivators percentage to total workers in 2001 was 31 [Rural-42 & Urban-2.5] and female cultivators percentage was 32.9 [Rural-37.1 & urban-4.1].


Following map shows the difference in percentage of cultivators during last three census. During last three decades there is horrible difference, and it has to a stage requiring urgent and immediate attention. It requires a vision plan to tackle it and save Agriculture and Agricultural Land. Provided we as society have to cope with scarcity of food (food shortage) Can I add that the price rise of vegetables and other edible commodities is also a cause of concern.

The belt which we have known as “Plain” Ganga Jamuna plain, doab दोआब, and has been most fertile land, has been providing food (foodgrains) since centuries is now at danger. This green land is now turning into yellow, I mean in the map.
Here I am talking about percentage of cultivators that has been decreasing in consecutive censuses. Who else other than cultivator will provide food to increasing population?
In Uttar Pradesh cultivator percentage to total workers has decreased to 35.6 in 2011 from 48.7 of 2001. In rural UP Male cultivators was 39.2% in 2011 but it was 52.2% in 2001 and Female cultivators in rural UP was 25.5% in 2011 that was 38.9% in 2001.
I assume when we say the food producers then we imagine cultivators and not Agricultural Labourers. Thus Who is cultivator as per census concept is?

I don’t think that only Agriculture Labourers will provide food in future problem of food scarcity or diminishing Agricultural land. But if Agricultural labourers are decreasing then it can be inferred that either mechanization of Agriculture has increased or Agriculture work has reduced ( I read it as diminishing agriculture).
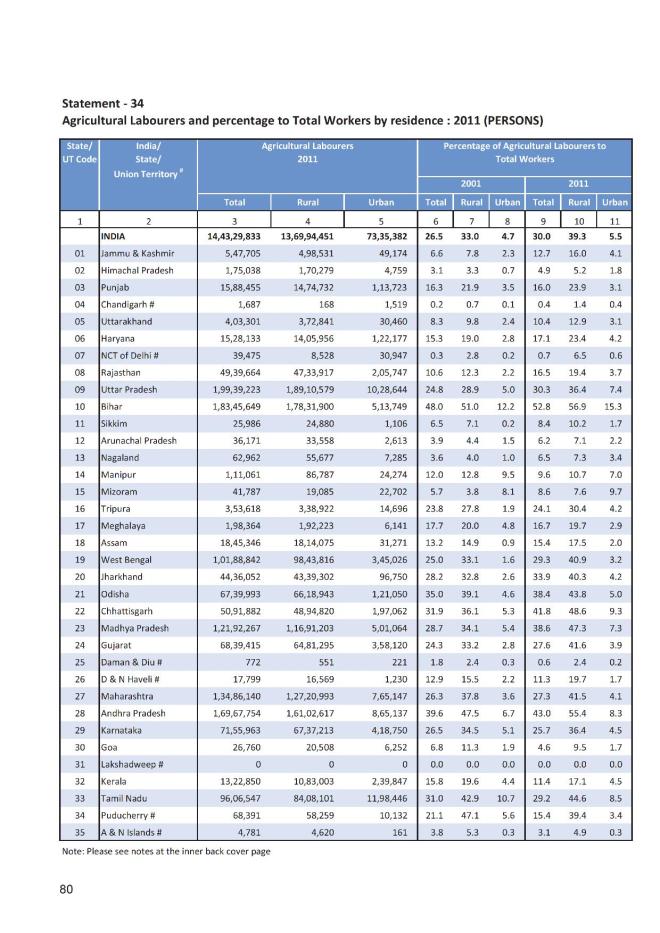
In India as per 2011 census percentage of Agriculrural Labourers to toal workers was 30 [rural- 39.3 & urban- 5.5] while that of 2001 was 26.5% [rural- 33 & urban- 4.7].
Strange!!! Agriculture Labourers has increased over the decade. That means still mechanism has not impacted labour element in agriculture.
In 2011 Male AL were 24.9% [rural- 34.4 & urban- 4.6] whereas in 2001 male Al were 20.8 [rural-27.5 & urban- 3.4]
Female AL percentage was 41.1 in 2011 [rural -48.5 & urban -9.0] and in 2001 it was 38.9% [rural- 43.0 & urban – 10.7]
Highest percentage of AL in country was in Bihar at 52.8% [rural – 56.9 & urban 15.3] in 2001 it was 48% [rural- 51 & urban 12.2].
Second highest Agricultural Labourers(AL) were AndhraPradesh at 43% [rural- 55 & urban- 8.3] in 2001 it was 39.6% [rural- 47.6 & urban 6.7]
Third highest percentage of AL was in Chattisgarh at 41.8% [rural- 48.6 & urban -9.3] whereas in 2001 it was 31.9% [rural-36.1 & urban-5.3].
Female highest AL were in Bihar with 60.8% [rural 63.4 & urban – 20.1] in 2001 it was 62.6 [rural-64 & urban-26.4]. Second highest female agricultural labourers were in Andhra Pradesh with 58% [rural- 67.3 & urban-14.6]
Following is another statistics about our Agriculture taken from a report titled “State of Indian Agriculture 2015-16″. I have taken data of few years so as to compare.
| year (Thousands hectares) | 1970-71 | 1990-91 | 2000-01 | 2013-14 |
| Permanent pastures & grazing land | 13261 | 11406 | 10662 | 10258 |
| Culturable waste land | 17500 | 15000 | 13631 | 12388 |
| Not available for cultivation | 44606 | 40728 | 41235 | 43860 |
| Other uncultivated land excluding fallow land | 35128 | 30219 | 27737 | 25832 |
| Net area sown | 140863 | 142870 | 141336 | 141428 |
| Cultivated land | 151461 | 156710 | 156113 | 155581 |
| Agricultural /cultivable land | 182056 | 185187 | 183455 | 181850 |
| Crop intensity | 117.7 | 130 | 131.1 | 142.0 |
| Net irrigated | 31103 | 48024 | 55205 | 68100 |
| Area under crops | ||||
| Tur (Arahar dal) | 2347 | 3610 | 3665 | 3527 |
| Total pulses | 22534 | 24883 | 21325 | 23779 |
| Total food grains | 124910 | 127948 | 122680 | 125136 |
| Sugarcane | 2589 | 3908 | 4662 | 5526 |
| Mustard & rape seed | 1415 | 5143 | 4174 | 6055 |
| Total oil seed | 14719 | 25152 | 24625 | 30111 |
As this data suggests there is something called as permanent pastures or grazing lands under the categories of Land Use Statistics. from above table it shows that our pasture land that were used as grazing lands have decreased over the decades. people from Animal Husbandry or Agriculture departments know there has been a scheme under which govt supports such grazing lands either providing fodder seeds or fencing materials or subsidy etc through Panchayats or via departmental channels.
Land under irrigation has increased over the years along with Crop intensity. Area under crops has increased for pulses but low than that of 1990. land under Arahar dal has decreased. does it means framers don’t want to grow Arahar dal? Cant say unless we compare with the actual production data. Similarly land area under crop sugarcane and mustard including grape seeds has also increased
Cultivator: For the purpose of the census a person is classified as cultivator if he or she is engaged in cultivation on land owned or held from government or held from private persons or institutions for payment in money, kind or share. Cultivation includes effective supervision or direction in cultivation.
